Survival Free of ASCVD Based on Lipid Discordance
Key Findings:
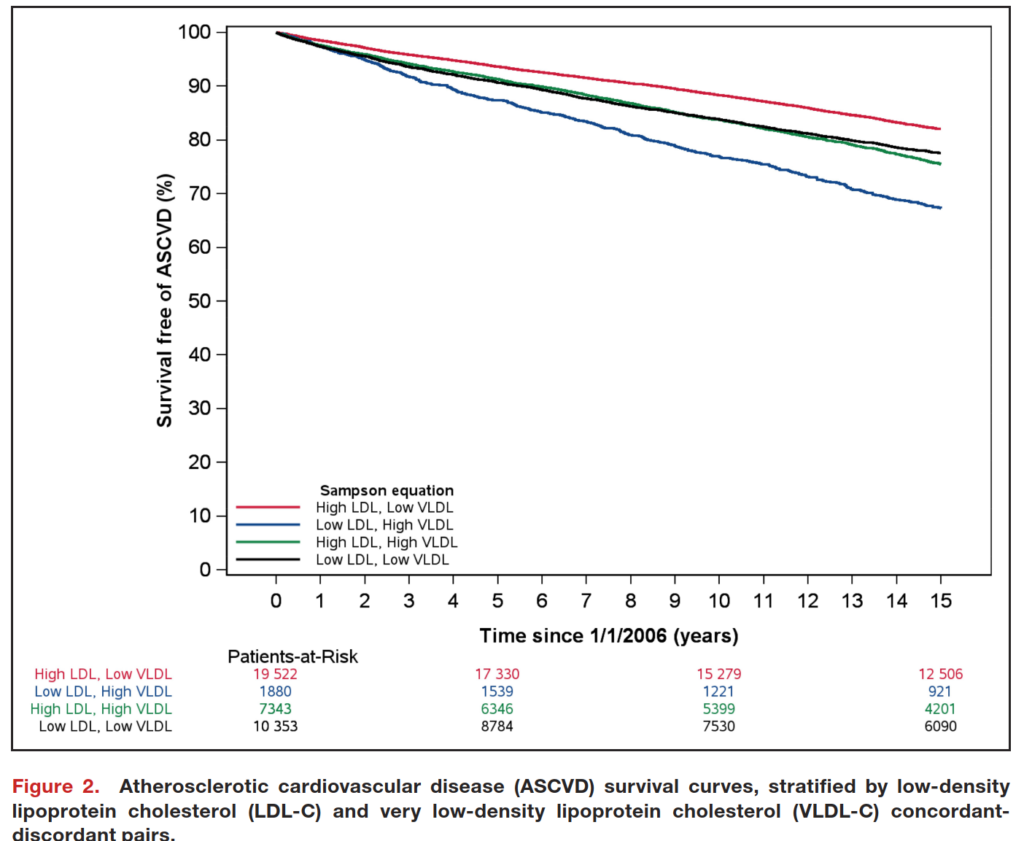
The Kaplan-Meier survival curve tracks patients free of Atherosclerotic Cardiovascular Disease (ASCVD), based on their LDL-C and VLDL-C levels. The groups are color-coded, and their survival over time is monitored.
- High LDL, Low VLDL: This group (red line) has the best survival rates, indicating they are at the lowest risk of ASCVD. High LDL-C alone does not lead to the highest cardiovascular risk.
- Low LDL, High VLDL: The blue line shows the group with the lowest survival rates. This group is at the highest risk of ASCVD, highlighting the significance of elevated VLDL-C, even when LDL-C is low.
- High LDL, High VLDL: Represented by the green line, this group shows intermediate risk. While both LDL-C and VLDL-C are elevated, their survival outcomes are better than the low LDL, high VLDL group.
- Low LDL, Low VLDL: The black line shows survival outcomes for this group are better than the discordant low LDL, high VLDL group but not as high as the high LDL, low VLDL group.
This figure emphasizes the importance of considering both LDL-C and VLDL-C when evaluating cardiovascular risk. Elevated VLDL-C, even with low LDL-C, is a critical risk factor for ASCVD.